Market Monitor Trends and Breadth July 24 BMO
By Kristoff De Turck - reviewed by Aldwin Keppens
Last update: Jul 24, 2025

(All data & visualisations by ChartMill.com)
Daily Market Trend Analysis – July 23, 2025 (After Market Close)
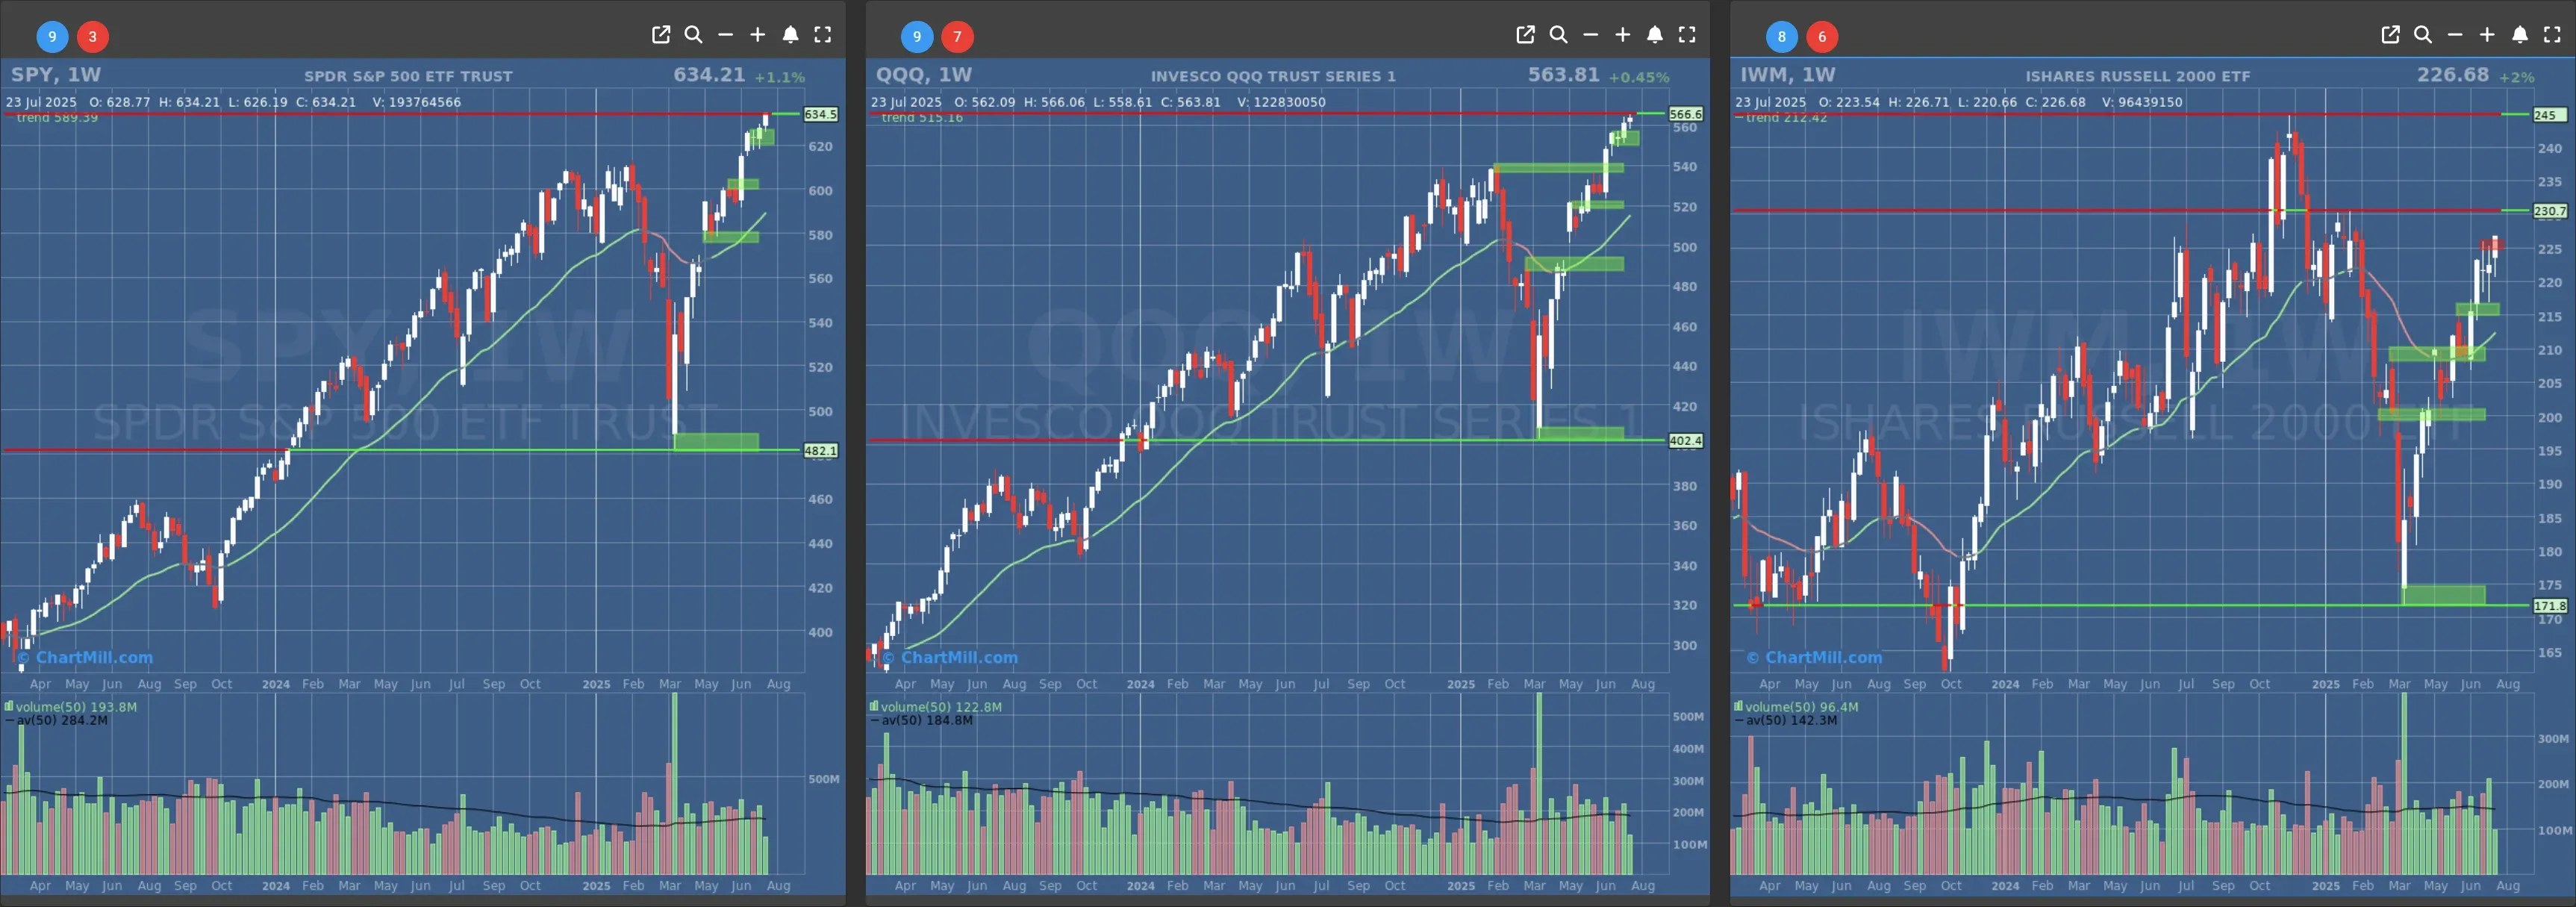
New All Time High for SPY and a strong Up Day for IWM
Short Term Trend

- Short-Term Trend: Bullish (no change)
- Next Support at $620 - $600
- Next Resistance at $632
- Volume: At Average (50)
- Pattern: Up Day - Gap Up- New All Time High
- Short-Term Trend: Bullish (no change)
- Next Support at $550 - $540
- Next Resistance at $566
- Volume: Slightly below Average (50)
- Pattern: Up Day - Hanging Man
- Short-Term Trend: Bullish (no change)
- Next Support at $220 - $215
- Next Resistance at $225
- Volume: Slightly Above Average (50)
- Pattern: Strong Up Day - Gap Up
Long Term Trend
- Long-Term Trend: Positive (no change)
- Long-Term Trend: Positive (no change)
- Long-Term Trend: Positive (no change)
Daily Market Breadth Analysis – July 23, 2025 (After Market Close)
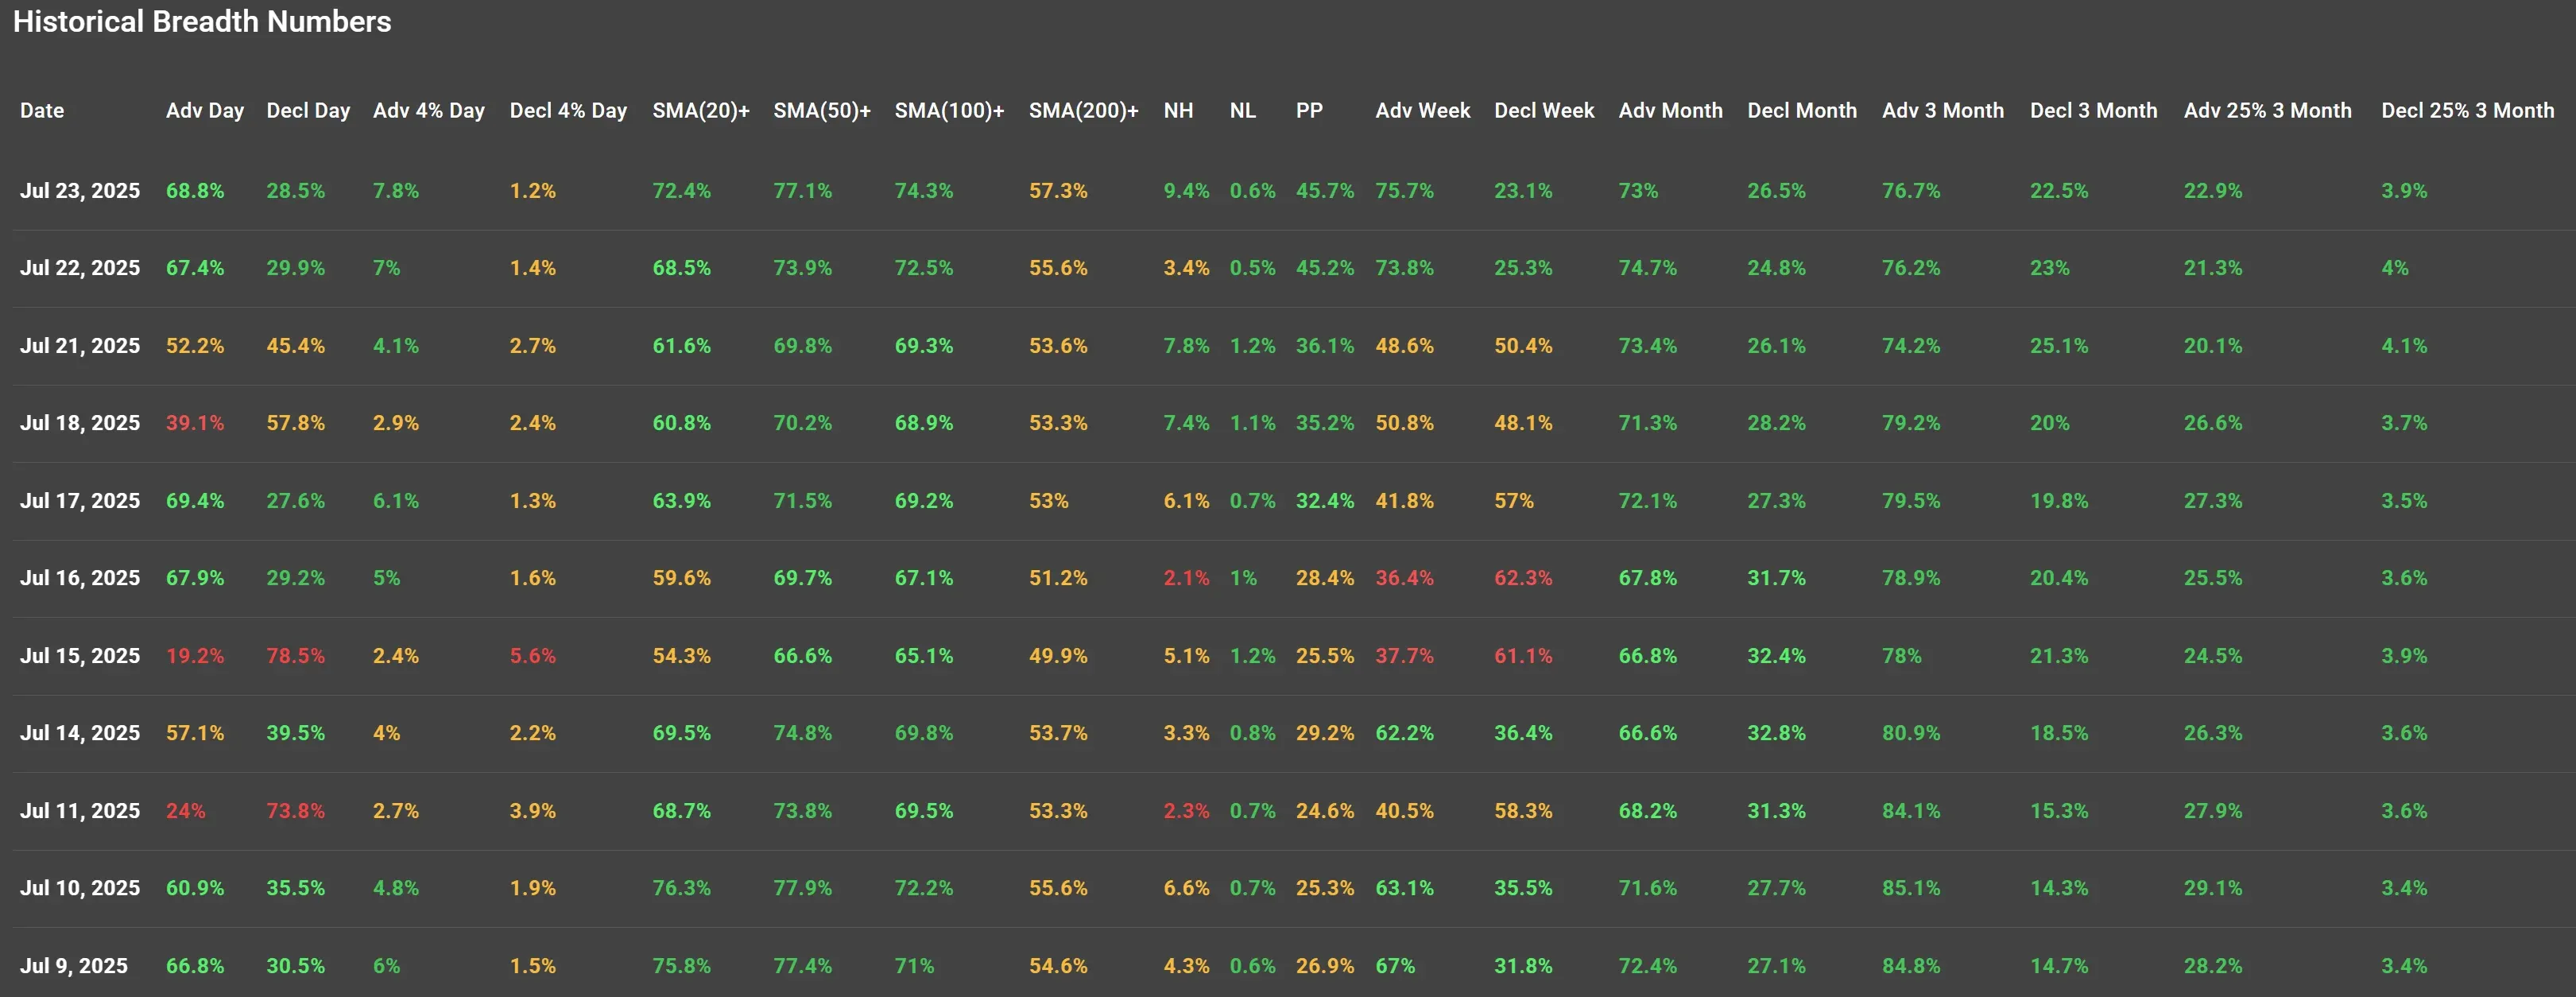
Market breadth data for Wednesday, July 23, 2025, confirms a strong continuation of the rally that began last week. This marks the fifth out of the last six sessions with broad-based strength across key internal metrics, suggesting that buyers are firmly in control and the underlying momentum is gaining traction.
The most recent data shows notable improvement in both short- and longer-term breadth indicators, validating the bullish tone we already observed on Tuesday, July 22.
Advancers vs. Decliners
-
Advancers rose to 68.8%, up from 67.4% on July 22.
-
Decliners declined further to 28.5%.
-
Advancers gaining 4%+ increased to 7.8% (vs. 7.0% on Tuesday).
-
Decliners falling 4%+ fell to 1.2%, their lowest since July 17.
This is the second consecutive session with over two-thirds of stocks advancing and a rising percentage of stocks making significant moves (4%+), which signals improving upside momentum and broad participation.
Moving Averages Participation
All tracked moving average breadth metrics rose again:
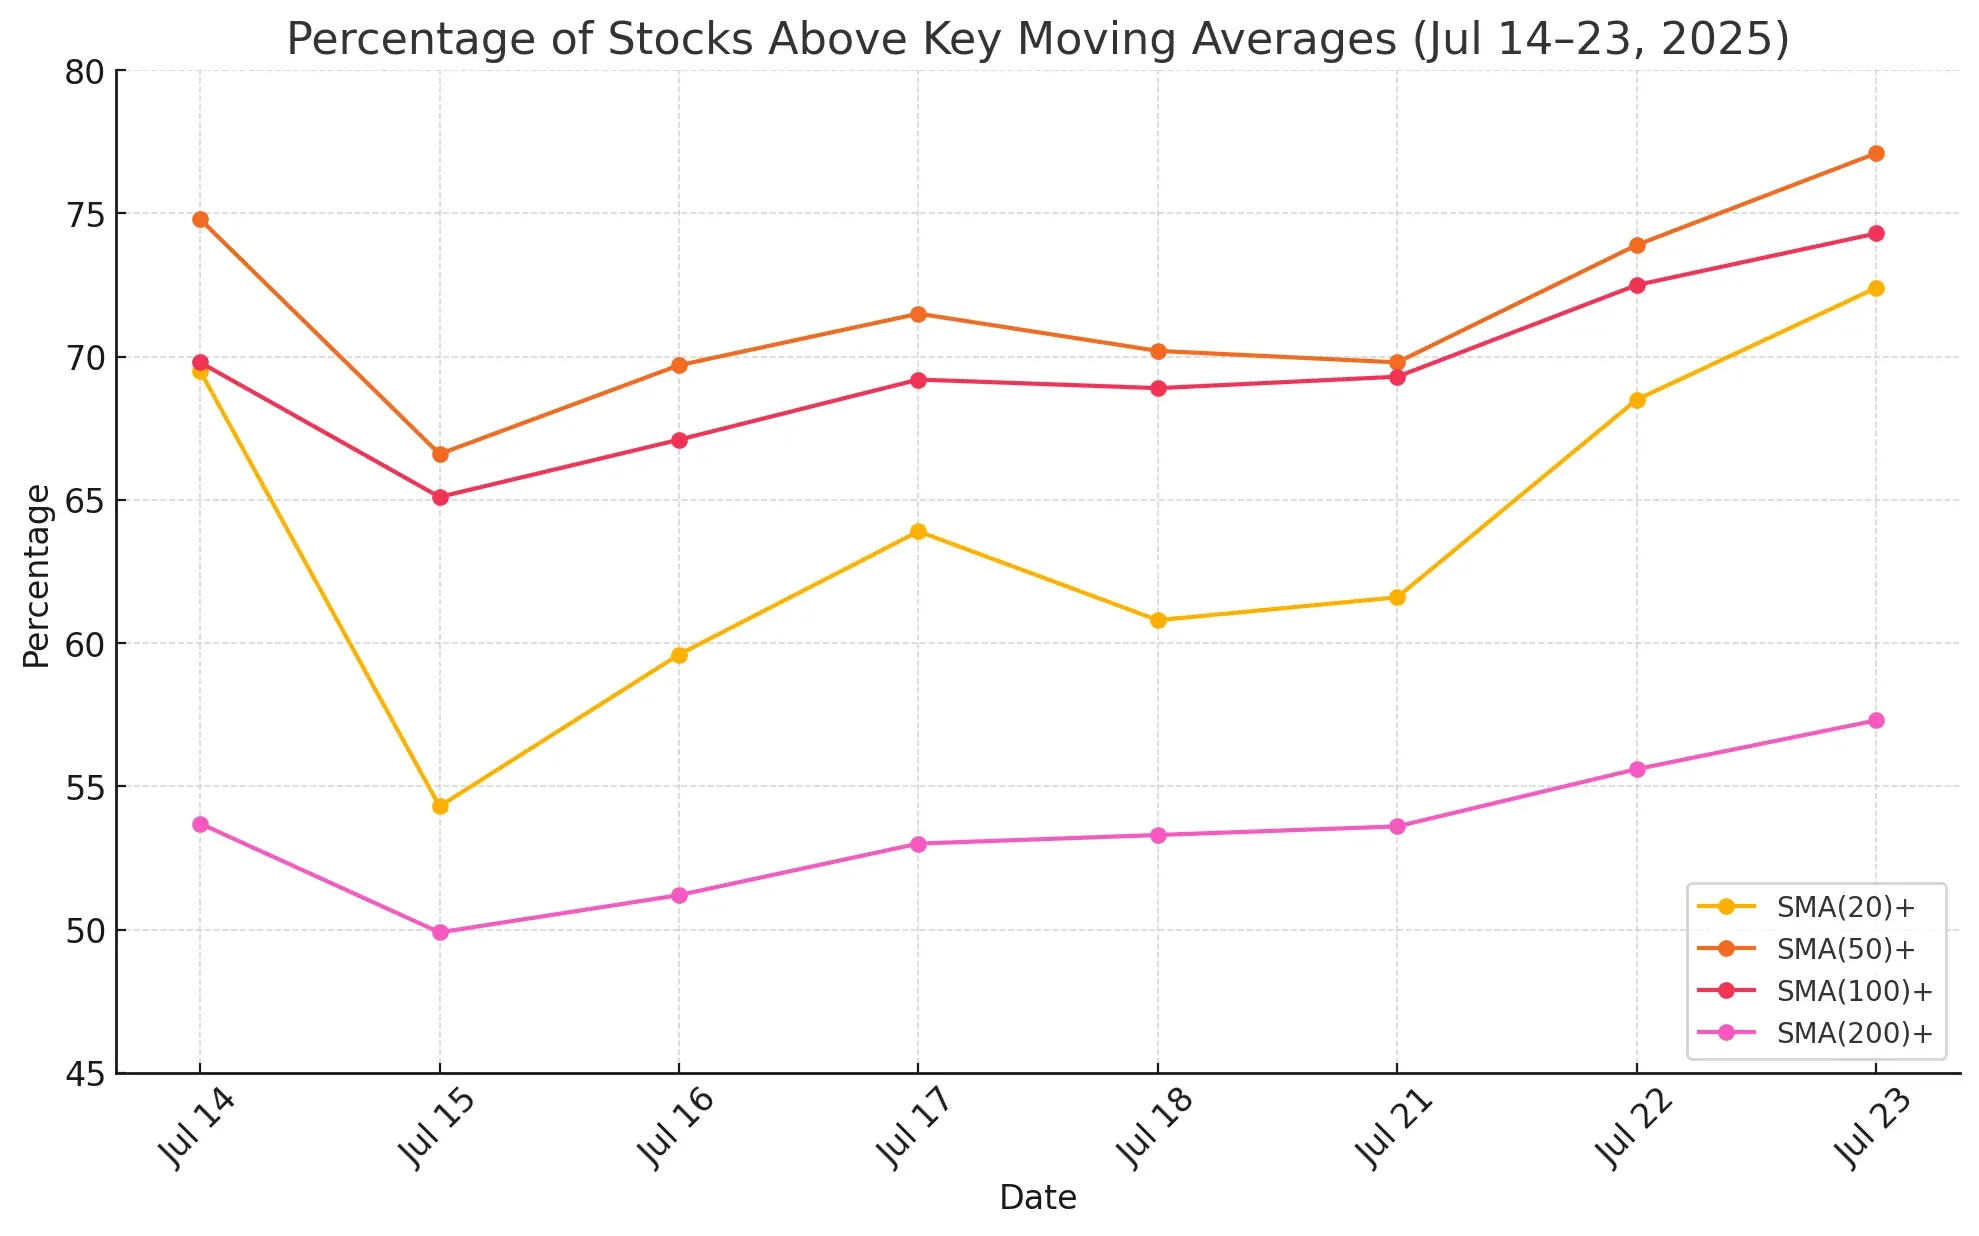
The percentage of stocks above their 200-day SMA is now at its highest point in nearly two weeks, which suggests improving confidence in the long-term trend structure.
New Highs vs. New Lows
-
New Highs (NH): surged to 9.4% (from 3.4%)
-
New Lows (NL): held steady at 0.6%
This dramatic increase in new highs - the strongest NH reading in the past 10 days - is a clear bullish signal and aligns with the rise in momentum names we observed earlier in the week.
Weekly Breadth
-
Advancing Week: 75.7%
-
Declining Week: 23.1%
This confirms weekly breadth remains extremely strong, with no signs of rotation into weaker names or defensiveness.
Monthly and Quarterly Breadth Trends
-
Advancing Month: 73%
-
Declining Month: 26.5%
-
Advancing 3-Month: 76.7%
-
Declining 3-Month: 22.5%
-
Adv 25%+ over 3 months: 22.9%
-
Decl 25%+ over 3 months: 3.9%
These longer-term metrics have remained stable or strengthened further, reflecting consistent performance and strong relative leadership among growth and momentum names.
Trend Continuation vs. Previous Day (Tuesday, July 22)
Tuesday’s session was already strong in its own right, with 67.4% advancers and improved participation across key SMAs. Wednesday’s session built directly on that strength, with:
-
Higher % of strong advancers (4%+)
-
Higher % above major SMAs
-
A breakout in new highs (9.4%)
-
Increased leadership over longer timeframes (Adv 25%+ 3-months)
This is not just a continuation, but a broadening and deepening of the bullish internals, suggesting more sectors and stocks are joining the uptrend, not fewer.
Contextual Notes
No major economic news was released during market hours on July 23, but the market seems to be pricing in a trade deal with Japan and an imminent agreement with the European Union, themes that have slowly buoyed sentiment throughout July.
It’s important to note that this surge in breadth predates any after-hours earnings surprises or macro headlines released post-close.
Conclusion and Breadth Trend Rating
With five out of the past six sessions showing strong, consistent breadth and with key longer-term metrics improving in tandem, the internal structure of the market has clearly shifted in favor of the bulls.
Breadth Trend Rating: 5 – Very Positive

This rally is no longer driven by a few large caps. We’re seeing growing participation from mid- and small-cap stocks, stronger leadership breakouts, and improving long-term breadth — all signs of a healthy, durable uptrend.
Kristoff - ChartMill
Next to read: Market Monitor News, July 24
214.92
-4.47 (-2.04%)
553.88
-11.13 (-1.97%)
621.72
-10.36 (-1.64%)
Find more stocks in the Stock Screener
IWM Latest News and Analysis